Sunday, April 17, 2011

Tutorial Blog 4: Video Conferencing

Video Conferencing is an excellent tool for businesses to communicate with one another face to face while not having the hassle of traveling to the exact geographical location of the other business. It is a convenient tool to have and removes the stress of commuting to and from meetings. Now that video conferencing hardware and software has become so affordable many companies use it.
In order to engage in a video conference with someone you must have a computer, video conferencing software or web application like skype, microphone, speakers, and a built in or attached video camera.
An example of a video conferencing software is Cisco's WebEx which allows the user to invite multiple users to view their live video stream from their desktop, laptop, or mobile device. You can also record your video sessions to review for later use.
WebEx business meeting

WebEx is great for businesses to communicate but another online video conferencing tool thats is more for social networking is Skype. Skype is available for your desktop, laptop, mobile device, and tv.
Skype
I personally use Skype and enjoy the face to face interaction you can have with someone without leaving your home! Its a great way to connect with family members or friends that may live out of town.
Its easy to download and they offer a free trial to try it out! Just go to www.skype.com to get started!

Saturday, April 9, 2011

Secure Email Project


Big Brother: Being Watched at Work and the Truth about Email Security at the Office

The article above is warns employees, or anyone that uses email as a means of communication, to use secure emails because anyone can access your message and tamper with it. A list of potential threats if your email is not secure are : Eavesdropping, Identity theft, Invasion of Privacy, False messages and message modification, unprotected backups, and Repudiation. To avoid these threats you should make sure all of your incoming and outgoing emails are secure from unwanted readers by using encryption. 

Sunday, March 27, 2011

Tutorial Blog 3: Access

I chose access for my blog because I was very impressed with all of the different capabilities it offers the user and found it very useful. The part I found the most helpful was the table capabilities and how you can import external data into your database and put it into a table to analyze it. This aspect is useful if you want to import some data from excel ,or another application, to create a table to analyze the data and organize it into a form, query, or report.

I will demonstrate step by step instructions on how to do this below:
 First open up a blank database in access. Once the database is open go to the external data tab on the ribbon, which is at the top.
Gate Way illustration 


Now that you have found the external tab you need to specify what type of file you want to import into access, whether it is a text file, XML file, etc... You will see the buttons on the ribbon that are labeled "text file", "XML file" or "more" which gives you a drop down menu of other file types you are able to import. I will demonstrate how to import a text file since it is the most common. Just click on the type of file you wish to import and you will be directed to a browse window where you can browse for the file on your computer.


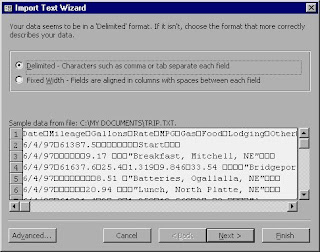
Once you have chosen the file you want to import the import text wizard window will appear giving you an option to choose whether your text is delimited or fixed width. If you've never used access your probably not familiar with the text formats so, delimited text is where the fields in the file are separated by characters such as semi-colons or commas. So if you open up your text file in a word document and it is separated by characters then it is probably delimited.
Fixed width text is when the text file's fields are aligned in columns to define specific character regions.

Learn Access Now Illustration

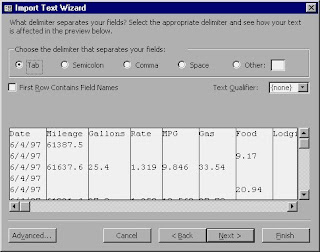
So if you tell access that your text file is delimited it will ask you to choose what kind of character separates your fields and gives you options to choose from such as, comma, semi-colon, tab, and space.


Learn Access Now Illustration


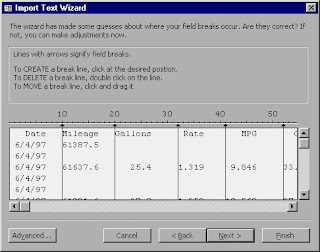
If you tell access that your text file is fixed width it will ask you where your break lines are and give you the option to make your own.

Learn Access Now Illustration


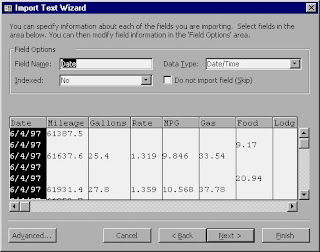
No matter which one you pick, delimited or fixed width, you will be brought to the next step where you can name your fields and define their data types, whether it be text, integer, date/time, etc... Once you have completed these steps you will be asked to name the file and then it will be imported into a new table.

Learn Access Now Illustration

Wallah! You have just imported your external data file and are ready to get started on your table! I hope you understood the steps clearly and were successful importing your file! I hope you find this feature as useful as I did!

Wednesday, March 16, 2011

Database Project

This project through me for a loop! I had never used access before so as I was watching the lectures this week it was all new to me. Needless to say, I learned a lot! I thought excel was useful, but boy oh boy I can really get some use out of access. I love all the organization it provides the user. I can imagine how useful the tables, reports and forms are for businesses and now that I know how to use access I hope it will help me out one day when I open my own small business. My favorite aspect was probably the report because it lays all of the information out for you in a neat, organized, and easy to read format. I also liked that you could sort your fields so you could read them more easily.

I think my database would have been more functional if I could have figured out how to group my cities together so that way the cities wouldnt have been listed multiple times. I had a difficult time getting them to group together even though I did step by step everything that the lectures said to do. It just didnt work as planned. But overall I thought that the database was pretty functional and would be useful to a gym owner who needs to know this information about his/her members.

Sunday, March 6, 2011

Bella Casa Designs-Presentation Project

This project was a hair puller but I have to say that when It was all done and over with and I had the chance to sit back and watch my presentation, I was proud of all my hard work. I learned how to use a whole new program, KeyNote, for the MAC and wrote a hypothetical business plan for an interior design company I hope to build some day. I enjoyed the whole process of creating a story line and filling in the gaps with pictures and little details about my make believe company.  I will definitely use the tools I learned through out this process in the future for work related projects. I hope you guys enjoy watching my presentation!

Here is a direct link to my presentation
Bella Casa Designs presentation


Is there a logical flow and sequence of content? 
I would say that my presentation has a logical flow and makes sense while watching it. 

Does the presenter anticipate questions and answer them in the right place?
I think i did a good job of answering any question a viewer may have when watching my presentation. I explained how our company started, who the employees were, where we are located, what we offer, etc. 

Did the presenter grab your attention in the first 30-60 seconds?
I hope that my presentation will grab the audiences attention within the first 60 seconds; I used alot of visuals to stimulate the viewers attention.

Did the presenter set the context with a concise explanation? 
I made it clear what my presentation was about and explained each slide carefully. 

Did the presenter avoid inconsistencies and errors, typos and unbelievable claims?
I made no spelling errors in my presentation and to my best ability spoke with correct grammar and fluidity. 

How well did the presenter avoid clutter?
Some of my slide may have had alot going on but I dont think the amount of items I had on the slide took away from the readers attention. Everything I said corresponded with the pictures on the slides.

What did the presenter do to ensure readability?
I made sure that the text was big enough to read and was visually pleasing on the slide.

Did the presenter say it, and then show it or did he/she read the slides?
I did read directly off of some slides but most of them had a corresponding explanation to go along with it. 

Wednesday, February 16, 2011

Tutorial Blog 2: Multimedia Graphics

I chose to research graphics this week because I am an avid picture taker and was genuinely curious about the different file formats used. 

Lets start off with a simple definition of multimedia: Multimedia is all the pictures, videos, and audio that are on any technological device that you probably use everyday like your phone or computer. But I'm going to focus on one type of multimedia that everyone is familiar with, graphics. 

Graphics, according to the "discovering computers 2010" textbook, are a digital representation of non-text information such as a drawing, chart, or a photo. Graphics are everywhere you look, like websites, magazines, books, tv, you name it graphics are in it! They are useful in illustrating concepts to readers/viewers, make boring reports easier to understand and more interesting to read, they can be used for  almost any purpose the user wants. Software like Microsoft powerpoint and Microsoft word have graphics stored in a folder called clipart for users to insert into their presentations for better understanding of a concept or just to jazz up the project's appearance. The picture to the right is a piece of clip art from the Microsoft word gallery. 

Sequential JPEG encoding and decoding processes

Graphics also have different types of formats but I will just discuss the two most common types: JPEG and GIF. JPEG  is a file format that compresses graphics so they wont take up so much storage space on your computers hard drive. It stands for "Joint Photographic Experts Group". Even though you can store many images in the JPEG format without worrying about taking up too much space, the negative aspect is the smaller the image the lower the quality. But the main goal of a JPEG file is to balance the size and quality of the graphic for the user. JPEG file formats are most common in digital photos because they do not limit the amount of color allowed in a graphic. The chart to the right, from Wikipedia.com, is a representation of how JPEG formats encode and decode graphics.
32 colors GIF
17 million colors JPEG
The next graphic format is GIF.  It stands for "Graphics Interchange Format". It is used when graphics only have a few basic colors in them. It is applied on graphics that are used for simple diagrams or company logos. GIF limits the number of colors allowed in a graphic, so the graphic in turn looks much sharper. A comparison of a JPEG formatted graphic and a GIF formatted graphic is above, from webwitchery.com


    Here is a video by smallbusinessplanned.com that I found on youtube. The voice on the video describes the differences between the graphic formats we have discussed, GIF and JPEG, as well as a couple others. I encourage you to watch this if you want more in depth knowledge about these formats we discussed.

Sunday, February 13, 2011

Excel Project

The excel project was a great learning experience for me since most of the tasks that were required I hadn't done before. Typing the data into the spreadsheet was no problem for me but when it came to calculating the values to enter into the cells with the formulas, I was a little confused. I did have a problem with the freeze panes though because we were asked to freeze both top rows but the only option from the drop down menu was to freeze only the top row. So I got the top row to freeze but the second row wouldn't cooperate.
Another problem I had was with the TgtHR column. At first I entered the formula into the cell and clicked the drag down button to copy the action to the remaining cells in the column but it wasn't working. I got a little frustrated but finally i figured out how to make it work. Also for the TgtAchieved column we were asked to determine whether the target heart rates were achieved by the people and I had never performed a function with a yes or no answer so that took me a little while to figure out. I finally realized to use a formula stating whether the value is greater (>) than the other value and the output was a true or false answer. I actually enjoyed practicing all of these functions and learning how to do them more efficiently.
The one part of the project that I didn't necessarily enjoy was making the pivot tables. Besides being showed on the lecture how to configure a pivot table, I had no prior experience with creating one so that part was a challenge. Once I played around with it for a while I figured out how to make one and they seem to be a very useful tool for displaying portions of data.  Overall I learned a lot throughout the project and I'm looking forward to using the skills that I have learned with my own personal projects.